Causal Multi-Touch Attribution
A simulation study unifying Incremental·Shapley channel credit and a path-level decomposition on a single Inhomogeneous Poisson Process — answering channel budget, journey design, and population causal effect under one efficiency identity (18-method benchmark, ground-truth MAE 0.016,
⏱️ TL;DR (30 seconds)
- What it is — a causal MTA that fuses Shender et al. (2023)‘s survival backbone (an Inhomogeneous Poisson Process, IPP) with Du et al. (2019)‘s Incremental Shapley into a single fitted model, then adds path-level Incremental Shapley (per-journey decomposition) and Conditional vs Marginal G-computation (two estimands).
- Why it matters — classic MTA answers correlation (Last Click, Shapley). This answers causation (“what if the ad were absent?”) with no A/B test — separating channel effect, temporal decay, synergy, and incremental lift from observational data alone.
- What it shows — against simulation ground truth, the lowest channel-credit error of 18 methods (MAE 0.016, #1) + 2nd-best budget allocation (MAE 0.019) + a rare low bootstrap variance among accurate methods (method-level mean CV 0.13). And channel·path·population views agree to 0.00% relative error under one efficiency identity.
 A credit layer and a path layer sit on a single Inhomogeneous Poisson Process (backbone), unifying channel budget · journey design · population effect under one efficiency identity (0.00% rel. error) — the core thesis of this work.
🎯 Key Results at a Glance
| Metric | Value | Notes |
|---|---|---|
| Channel-credit error | MAE 0.016 | #1 of 18 methods (vs ground truth) |
| Budget-allocation accuracy | MAE 0.019 | #2 (Du Incremental Shapley is #1 at 0.013) |
| Efficiency identity | 0.00% rel. error | channel·journey·population views agree |
| Bootstrap stability | mean CV 0.13 | its peers Incremental·Total Shapley sit at 0.60·0.99 |
| Ranking agreement | Kendall τ = 0.905 | robust agreement with the GT ranking |
| Two estimands | Conditional MAE 0.012 · Marginal MAE 0.020 | retrospective audit / forward, A/B-aligned |
| Data | 100K users · 7 channels · ~2.3% conversion | synthetic DGP (with ground truth) |
All numbers are against simulation ground truth — illustrative values produced by a synthetic DGP; real data has no ground truth (see Limitations).
🔬 The two experiments that matter most
The method’s two outputs, and the two experiments I consider most important here.
① Incremental vs Total — why “incremental” is non-negotiable. Raising the base conversion rate from ~3% to ~20%, I overlay two ground truths (GT_A = “who was present in the conversions”, the conditional / audit truth · GT_B = “what’s lost if you remove a channel”, the incremental / marginal truth an A/B test measures) and three operators (Incremental · Total · BackElim). The two truths share a ranking but differ in size (Paid Search GT_A 0.315 > GT_B 0.299; Display GT_B 0.084 > GT_A 0.061). Total Shapley credits the baseline too, so as the base rate rises it collapses upper-funnel (Display·Social) to zero and over-credits Paid Search beyond both truths. Incremental Shapley subtracts the baseline and stays inside the two-truth band — stable at any base rate.
In high-baseline businesses (subscription renewals, brand), using Total Shapley over-invests budget in Paid Search — not the real value driver. This is why incremental is required, not optional.
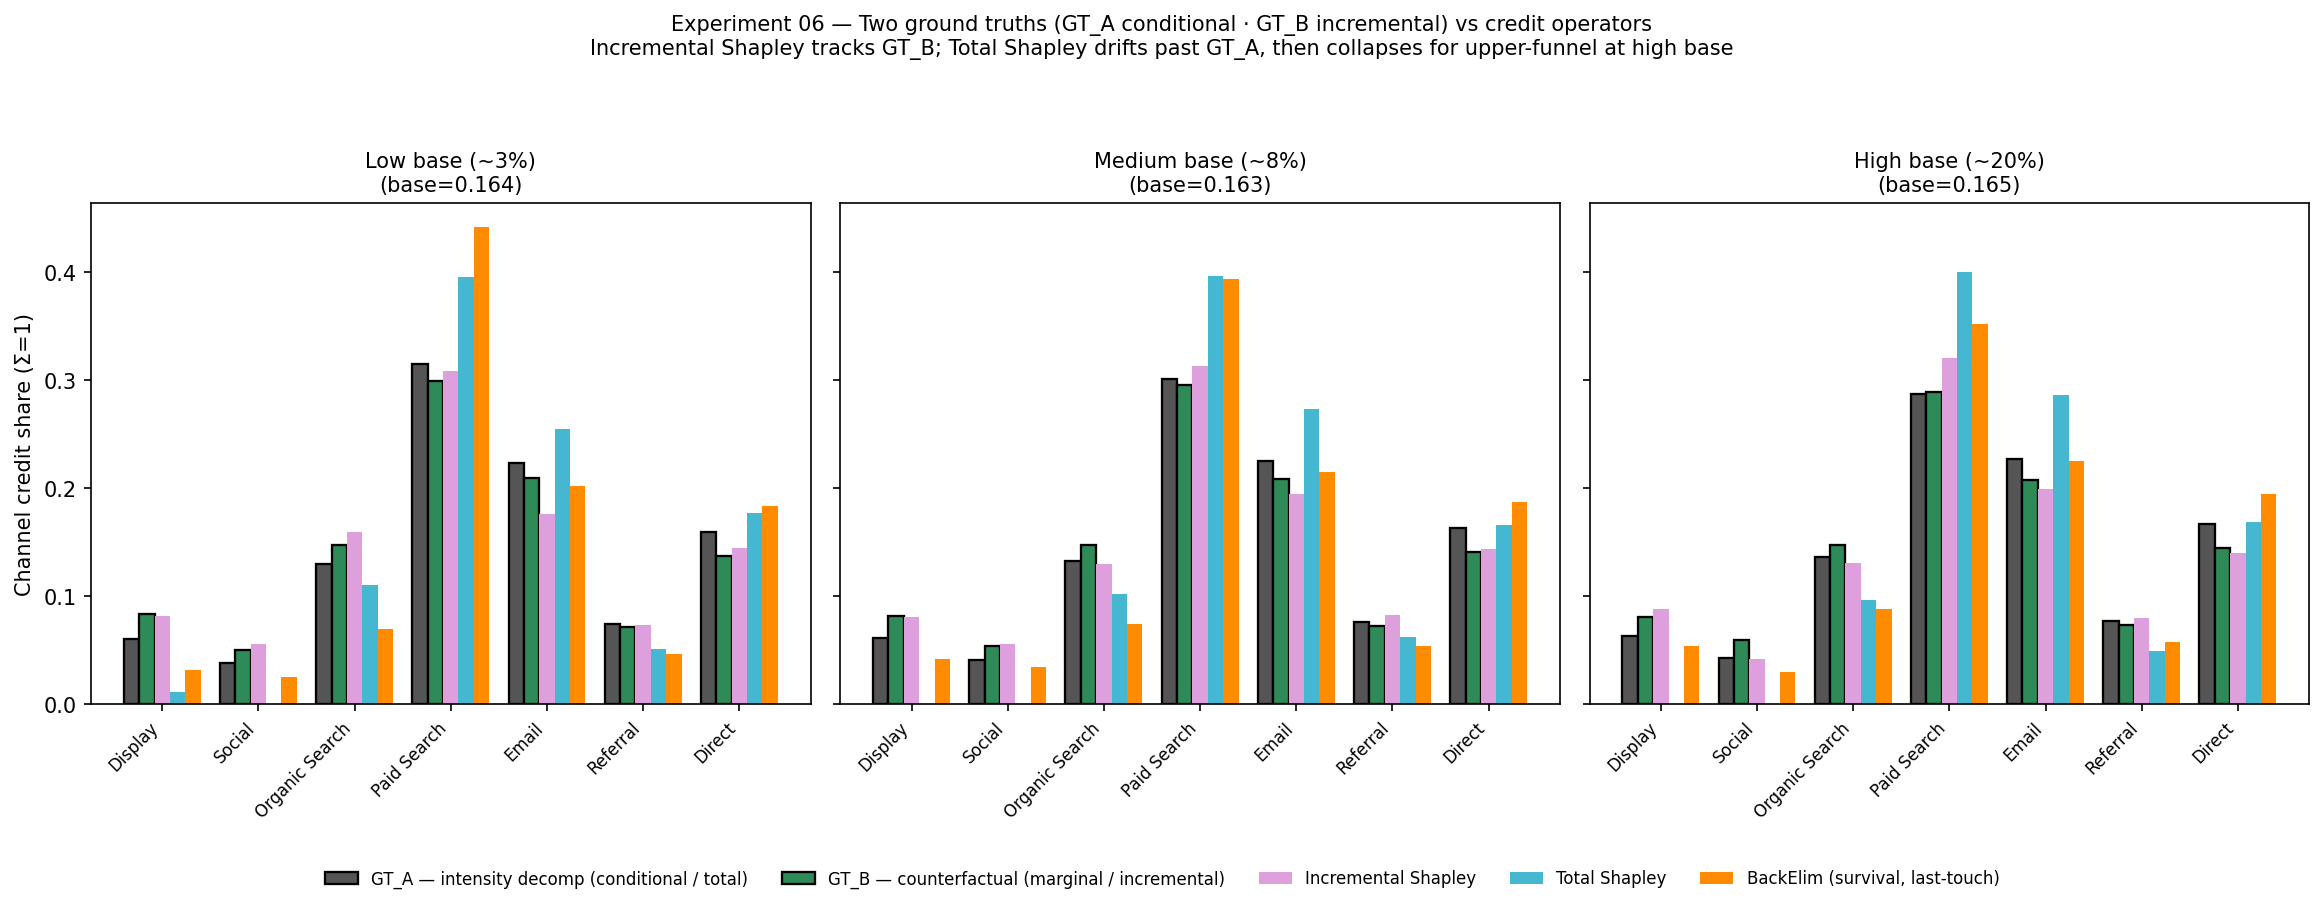 Five bars: two ground truths — GT_A (gray, conditional) · GT_B (green, incremental; both black-edged) — and three operators. Incremental (pink) stays inside the two-truth band, while Total (blue) departs from both — over-crediting Paid Search (high base 0.400 vs GT ~0.29) and collapsing Display·Social to 0 (GT 0.080·0.059 → Total 0.00). BackElim (orange) over-concentrates on the last touch. — why the real incremental credit matters.
② Multi-path — scoring journeys, not channels.
The same IPP is decomposed by journey template (ordered channel tuple) instead of by channel. Of 1,786 templates, a count ≥ 5 filter keeps 35 robust templates (covering 15.5% of converters) as reproducible campaign candidates. Top by total contribution (Email→Paid Search, …) = “what drives revenue now”; top by mean Δ (rare 3-step journeys) = “design candidates”.
“Which channel to fund” (budget) and “which journey to amplify” (campaign design) are usually separate analyses — here they come from the same efficiency identity, so the two decisions never contradict.
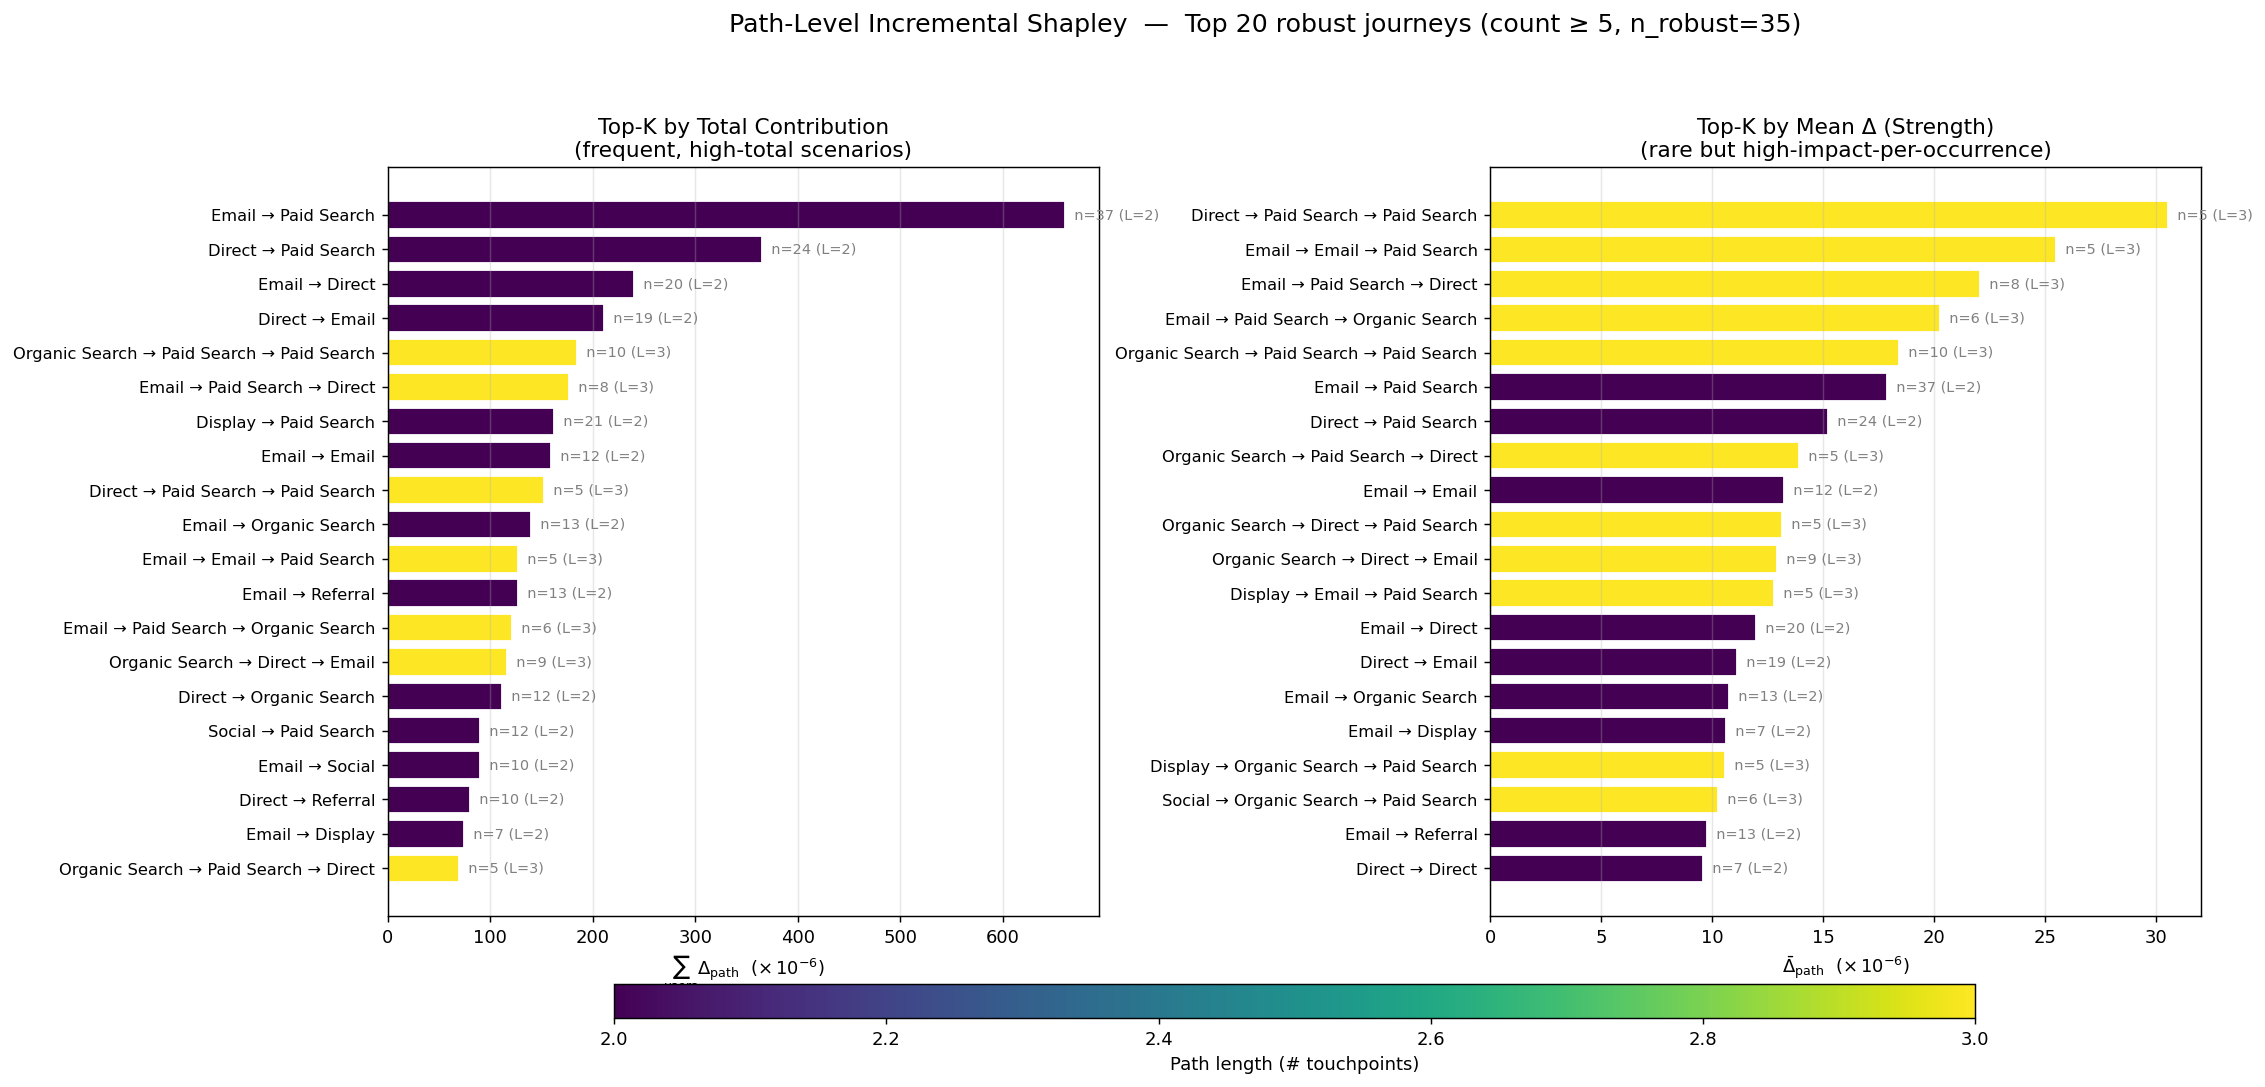 The 35 robust journeys ranked by path-level Incremental Shapley. (Left) total contribution = current revenue mainstays (short, frequent 2-step); (Right) mean Δ = design candidates (rare but strong 3-step). Color = journey length.
🧱 Method — three layers on a single IPP
The spine is three layers stacked on a single fitted Inhomogeneous Poisson Process (IPP). Fit the model once, then derive channel credit, journey decomposition, and population effect as the same game.
- Backbone (IPP) — a marketing journey is time-to-event data, modeled as a Poisson process whose intensity varies over time. I slice each touch into intervals and fit an interval-split Poisson GLM (offset = log Δt), handling right-censoring natively. It learns a 5-bin decay curve per channel — Paid Search ~1 day, Display ~14 days (below). The spec is chosen by AIC (no ground truth — key to deployment).
- Channel credit — two credit operators on the same IPP: BackElim (remove last→first, last-touch concentration, for bidding) and Shapley (mean marginal contribution over 128 coalitions, for budget allocation). The two agree on ranking at Spearman ρ = 0.929 — high agreement is a robust signal, large divergence a synergy diagnostic.
- Multi-path & two estimands — the per-journey decomposition (above) + Conditional (converters only, retrospective audit, MAE 0.012) and Marginal G-comp (all users, the do(remove channel) counterfactual = exactly the estimand an A/B test measures, MAE 0.020). Aggregating conditional on conversion is collider bias (the ambulance analogy), so budget decisions use Marginal.
The three views are tied by one efficiency identity — verified at 0.00% relative error:
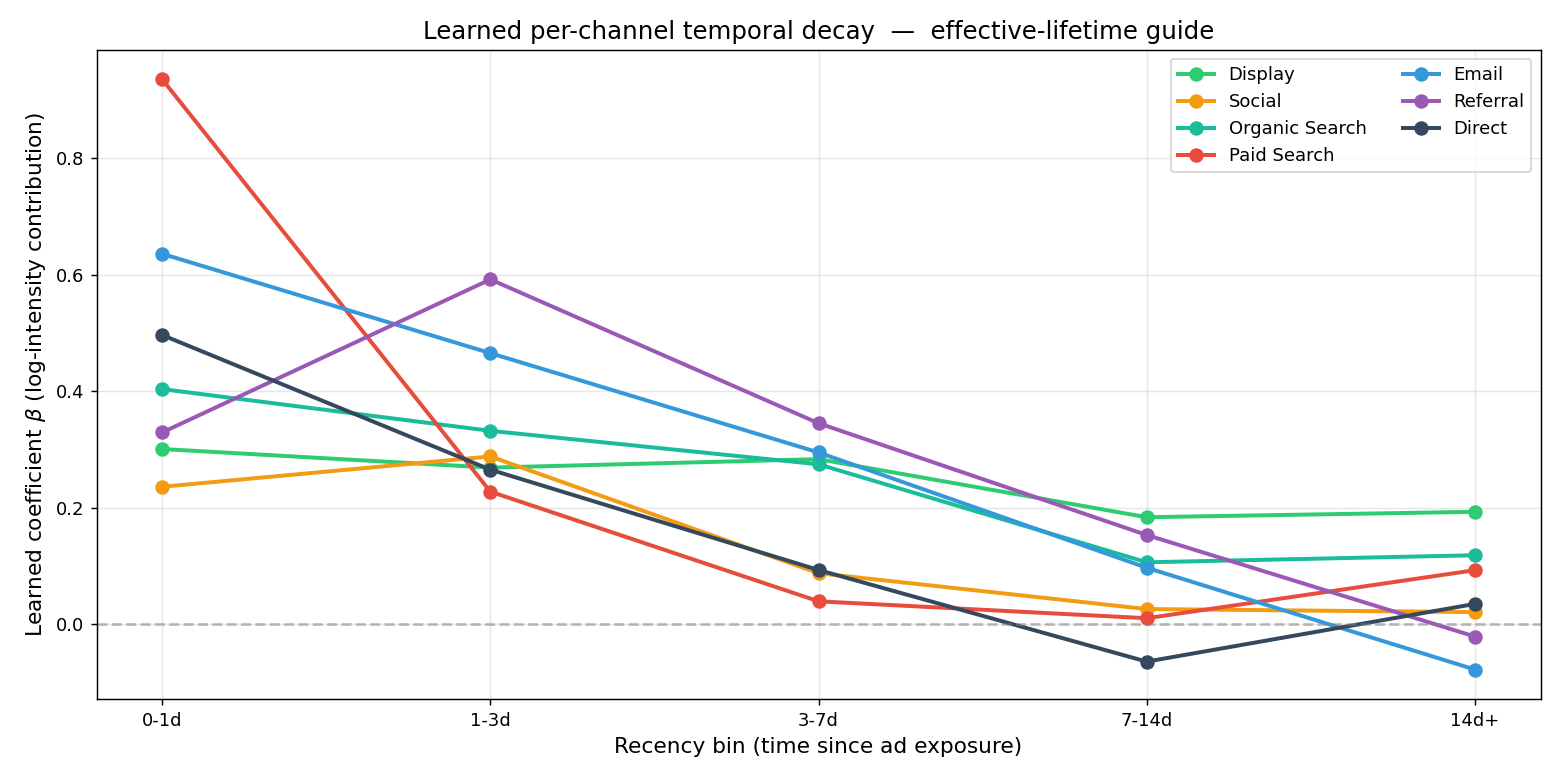 The per-channel decay (β, log-intensity contribution) the IPP learns from data. Paid Search peaks at 0–1 day then drops (effective lifetime ~1 day); Display persists to two weeks — time structure estimated directly, no lookback window assumed.
Derivations (intensity·credit·estimand) and the full 11-experiment gallery are deferred to the GitHub repository and
Methodology_05— this page keeps the core narrative only.
📊 Impact — honest results
I evaluated 18 methods against ground truth (the known DGP parameters). The main method leads on the combination of accuracy, stability, and decision quality — not on any single metric.
| Method | Channel MAE ↓ | Kendall τ ↑ | Allocation MAE ↓ | Bootstrap mean CV ↓ | Family |
|---|---|---|---|---|---|
| Survival/Poisson (Shapley) ⭐ | 0.016 (#1) | 0.905 | 0.019 (#2) | 0.13 | Causal (incremental) |
| Incremental Shapley (Du) | 0.029 | 0.905 | 0.013 (#1) | 0.60 ⚠️ | Causal (incremental) |
| CAMTA (Causal Attention) | 0.023 | 0.905 | 0.036 | 0.10 | Causal DL |
| Shapley (model-based, Total) | 0.035 | 0.905 | 0.117 ⚠️ | 0.99 ⚠️ | Game-theoretic |
| Last Click | 0.038 | 0.810 | 0.054 | 0.31 | Rule-based |
| DML / IPW | 0.050 / 0.074 | 0.524 / 0.333 | 0.045 / 0.090 | 0.93 / 0.66 | Causal (debiased) |
| Transformer (2L/2H) | 0.100 ❌ | −0.333 ❌ | — | 0.59 | Deep Learning |
| First Click | 0.158 ❌ | −0.293 ❌ | — | 0.14 | Rule-based |
(Source: results/part1/{01_method_accuracy,07_budget_optimization,10_bootstrap_stability}.csv. Bootstrap CV = method-level mean of per-channel CV. — means that exact variant was not bootstrapped.)
Four things to state honestly.
- “Best” — precisely. Survival/Poisson Shapley is a rare method that is #1 on error (0.016) and low in variance (mean CV 0.13). Its high-accuracy peers Incremental (0.60) and Total Shapley (0.99) are volatile, while the most stable method, Markov (~0.04), is inaccurate. So it leads on the combination, not on any single axis (CAMTA, at 0.023/0.10, is a close rival).
- Causal ≠ automatic win. Debiased estimators (DML 0.050, IPW 0.074) do not beat the best rule-based method (Last Click 0.038) under this DGP — confounding is moderate, so heavy debiasing yields no gain. The edge comes from the IPP + incremental modeling itself, not propensity correction.
- Total Shapley = a fragile winner. Its channel MAE (0.035) looks fine, but allocation MAE 0.117 and a mean CV of 0.99 (nearly the worst) make it unstable.
- The best rule-based is surprisingly competitive. Last Click’s MAE (0.038) isn’t bad. The real advantage of causal methods is satisfying ranking, allocation, and stability together and yielding interpretable outputs (decay curves, synergy, incremental vs total).
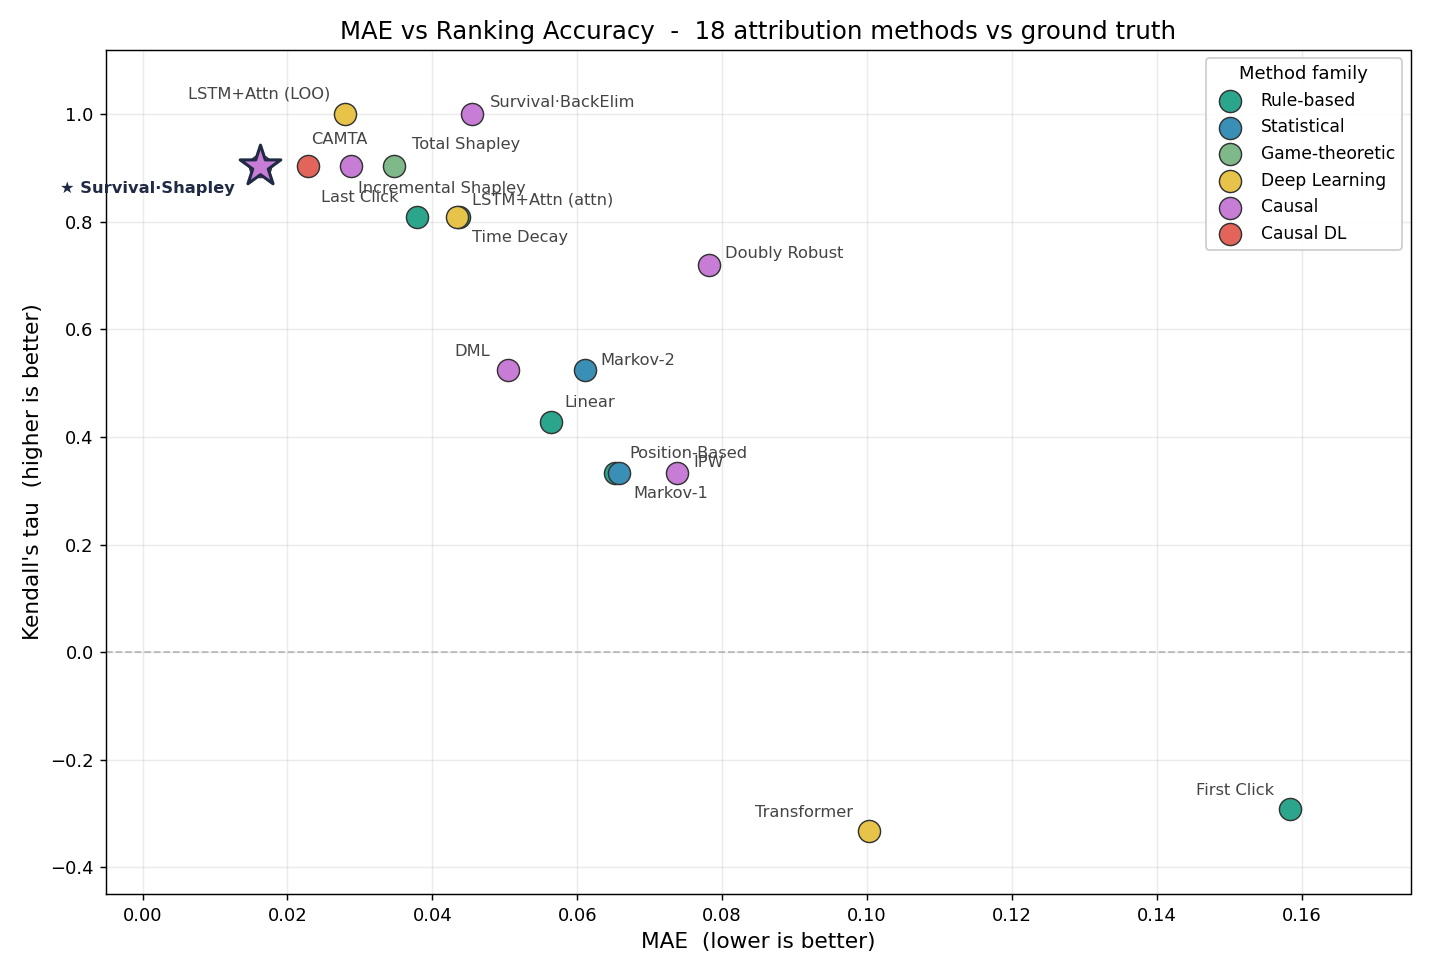 Ground-truth error (MAE, ↓ better) vs ranking agreement (Kendall τ, ↑ better). Causal / incremental methods (top-left) separate cleanly from heuristic / predict-only ones (bottom-right, negative τ).
🏭 How it’s used in practice — “Effect ≠ Efficiency”
The highest-effect channel can be the worst per-dollar. Attribution becomes an allocation decision only once combined with the cost structure.
| Channel | Effect (β) | Effect rank | Cost / touch | Efficiency (conv/$) | GT optimal budget |
|---|---|---|---|---|---|
| Paid Search | 1.2 | #1 | $2.50 (CPC) | 0.19 (last) | 0.09% ($181) |
| 0.8 | #2 | $0.003 | 152.7 (#1) | 73.7% ($147,345) | |
| Social | 0.4 | #6 | $0.008 (CPM) | 16.1 | 7.8% ($15,505) |
| Display | 0.3 | #7 | $0.005 (CPM) | 38.3 | 18.5% ($36,969) |
(Source: ground_truth.json — total budget $200K, revenue/conversion $100. Effect rank is over all 7 channels’ β; the table excerpts the 4 paid channels. Synthetic DGP values — illustrative.)
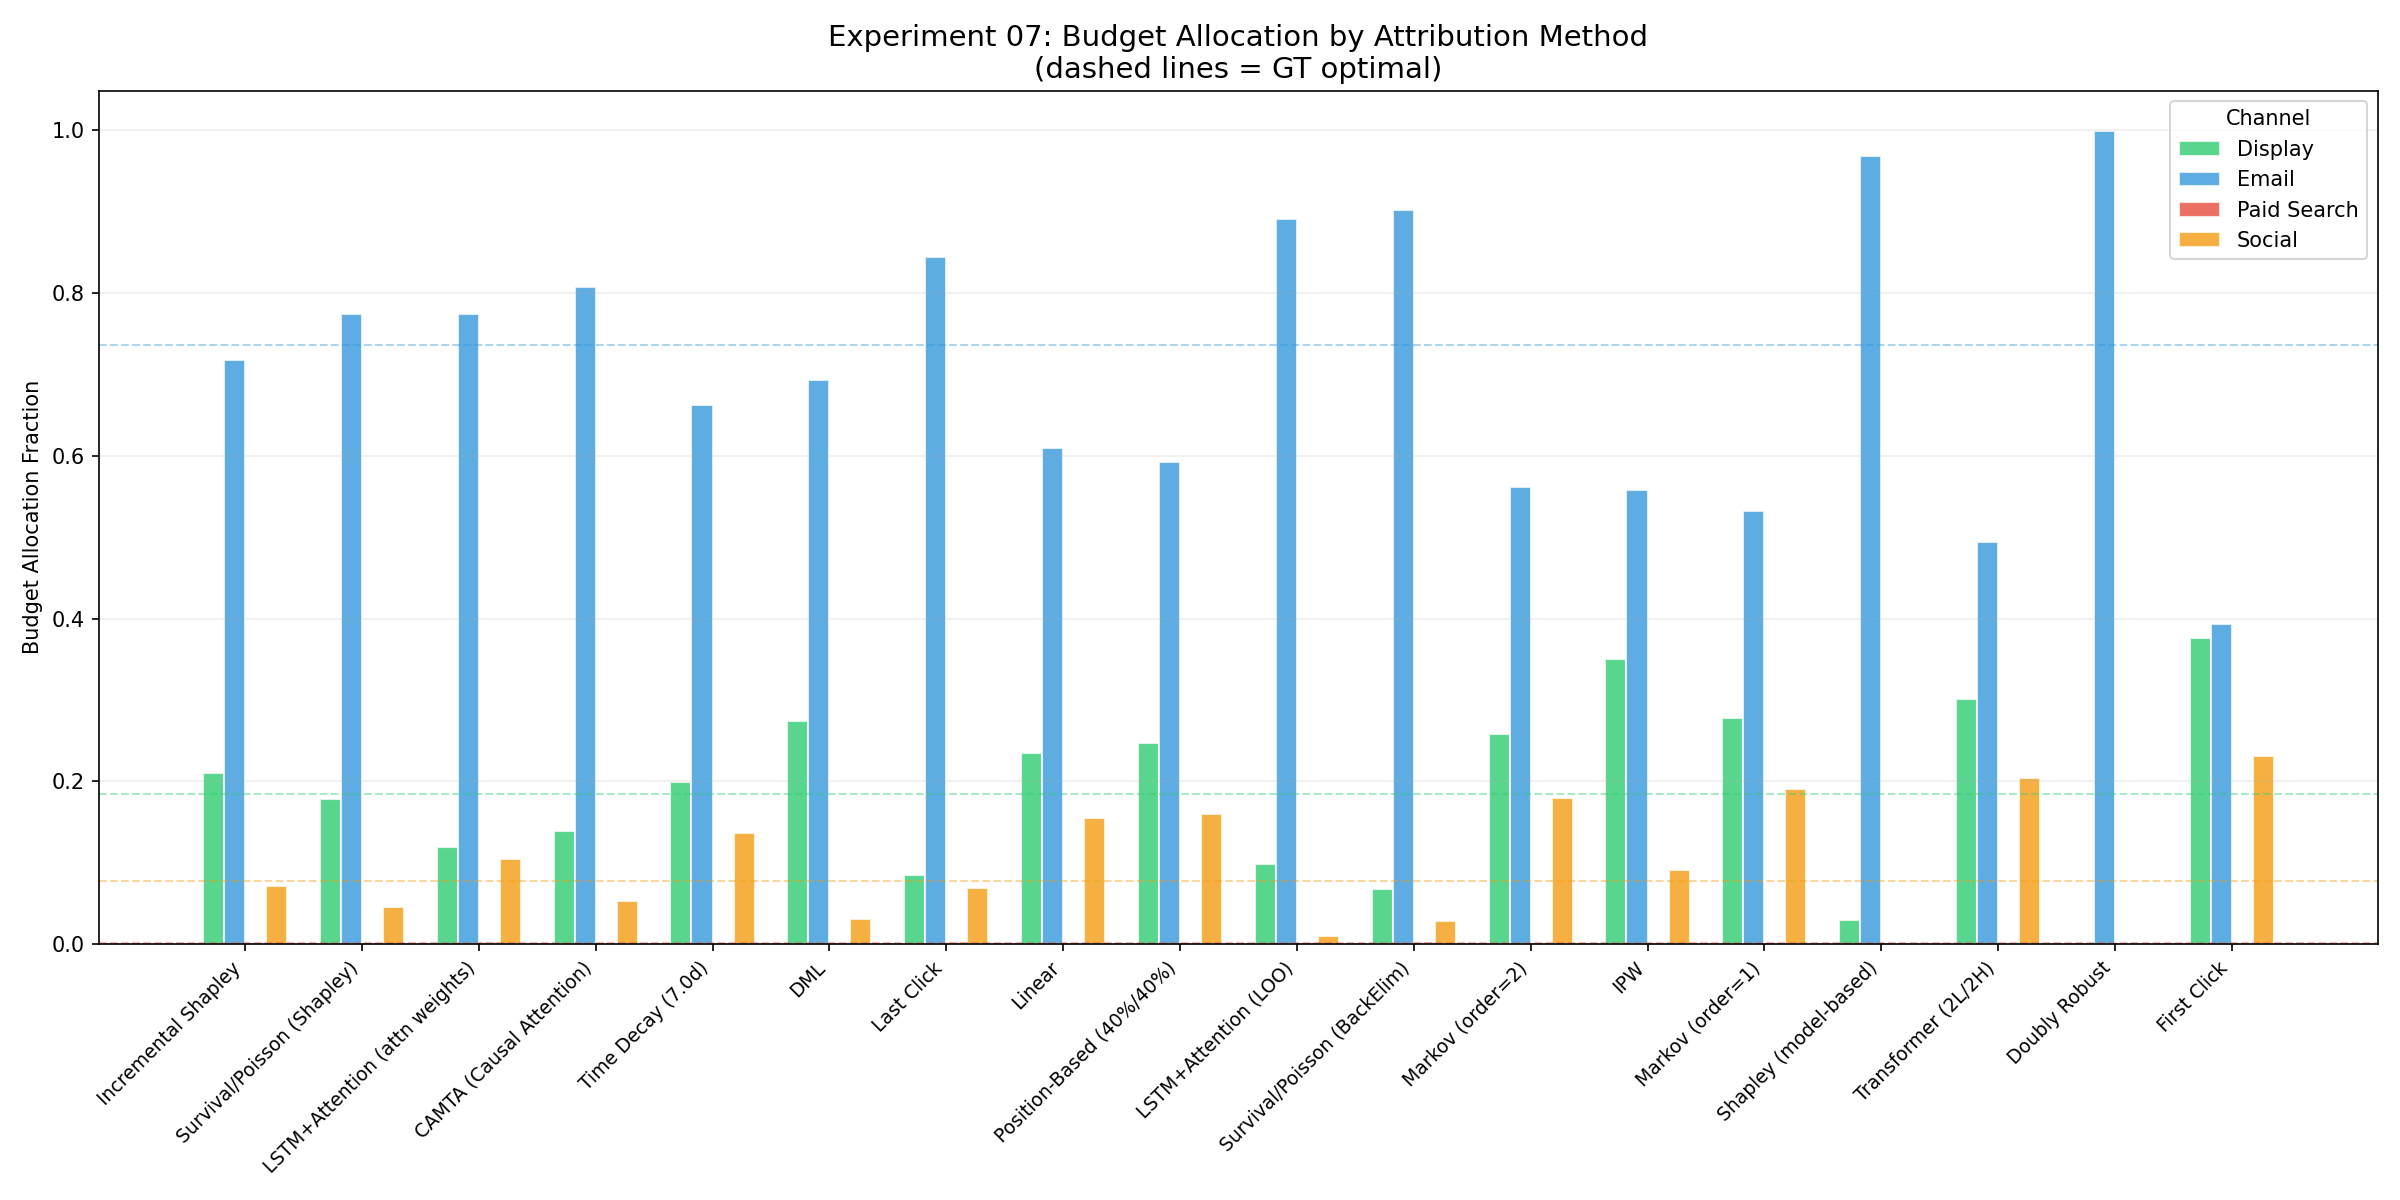 Paid Search ranks #1 on effect but, with an expensive CPC, its optimal budget is 0.09%; the true value driver is Email (73.7%). Incremental Shapley and Survival/Poisson Shapley land closest to the GT optimum.
Journey design — two lenses (a campaign question, not a budget one). Path-level Incremental Shapley reads the 35 robust templates (15.5% of converters) from two angles, turning them into an actionable playbook:
| Lens | Top templates (observed) | Action |
|---|---|---|
| Current revenue mainstays (total contribution) | Email→Paid Search (n=37) · Direct→Paid Search (n=24) | Defend·amplify — hold budget, strengthen bids |
| Design candidates (mean Δ per user) | Direct→Paid Search→Paid Search (n=5) · Email→Email→Paid Search (n=5) | Test·scale — design a nurture sequence via A/B |
Budget defends the mainstays while experiment budget grows the high-Δ rare paths — and since both come from the same efficiency identity, they never contradict.
Why this upgrade fits industry (the managerial case). This isn’t a model flourish — it’s a change that de-risks budget decisions:
- Avoids the wrong budget — Total Shapley and rule-based methods credit the baseline → over-allocate to Paid Search, missing the true efficiency leader, Email.
- Same backbone, swap only the credit operator → MAE 2.9× · allocation 4.4× better (BackElim→Shapley on the same IPP; 0.046→0.016, 0.083→0.019). The survival backbone handles right-censoring and time decay that rule-based misses.
- An estimand aligned with the decision — Marginal = the do(remove channel) effect an A/B test measures → the offline estimate is A/B-validatable and fits forward budgeting (rankings agree at ρ=1.000).
- Honest trust — low variance (mean CV 0.13) makes it reportable; labeled
causal — outcome-model onlyto avoid overclaiming, with the next step (DR/IPW-weighted survival) named.
Ultimately these outputs map onto four decisions — budget reallocation · journey design · decision rule (past = Conditional, future = Marginal) · uncertainty (bootstrap CI gate). The point: one fitted IPP answers all four.
⚠️ Limitations — honest scoping
- Relies on no-unobserved-confounding. Every estimand assumes an outcome model plus a sufficient confounder set . An A/B test remains the gold standard; observational analysis supports decisions, it does not prove them.
- Model–DGP match matters. The survival model collapses catastrophically on a Markov-type DGP (there, Time Decay is #1 by MAE). No method wins on every DGP — there’s a “home advantage”.
- Multivariate heterogeneity recovery is weak. Adding segment+device improves MAE only at the noise floor → a propensity-weighted survival model (DR/DML hybrid, Tier 2) is future work.
- Predictive power is modest. OOS AUC clusters around ~0.64 across methods (Experiment 08) → predictive validation is used only as a rejection gate, not as a method-discriminator.
- It’s a simulation. The price of ground truth is synthetic data. The next step is scale validation on Criteo (16.5M events) (Part 2).
All numbers are the canonical values from committed artifacts (results/part1/*.csv, ground_truth.json), against simulation ground truth and thus illustrative. Failures / weak results (First Click·Transformer negative τ, debiased non-superiority, Total Shapley fragility, Markov-DGP collapse) are reported as they are. Derivations, the 11-experiment gallery, and Quick Start are in the GitHub repository and the Methodology docs.